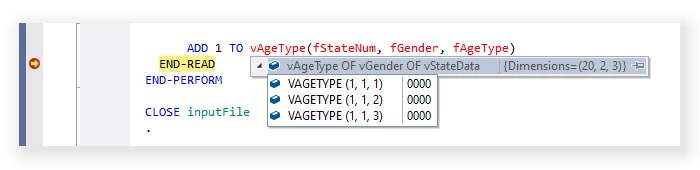
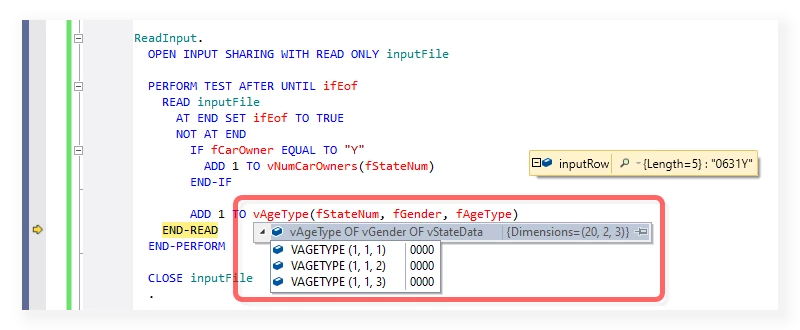
With the current version of Visual COBOL it's impossible to inspect multidimentional table data items in a debugging session:
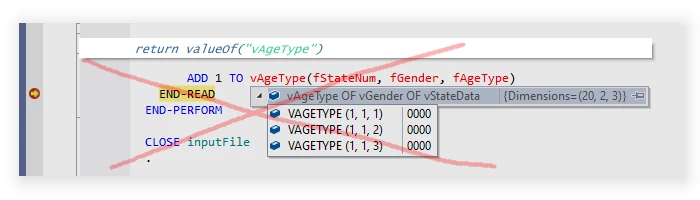
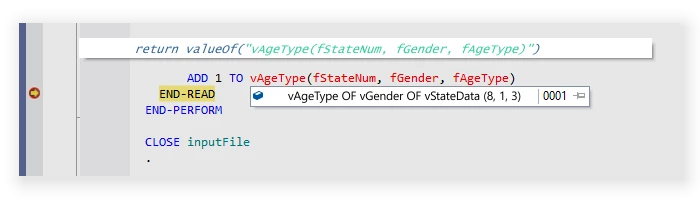
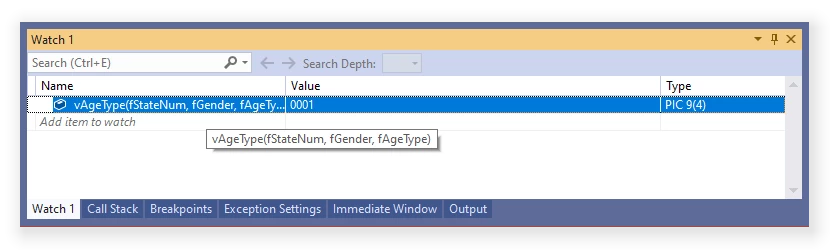
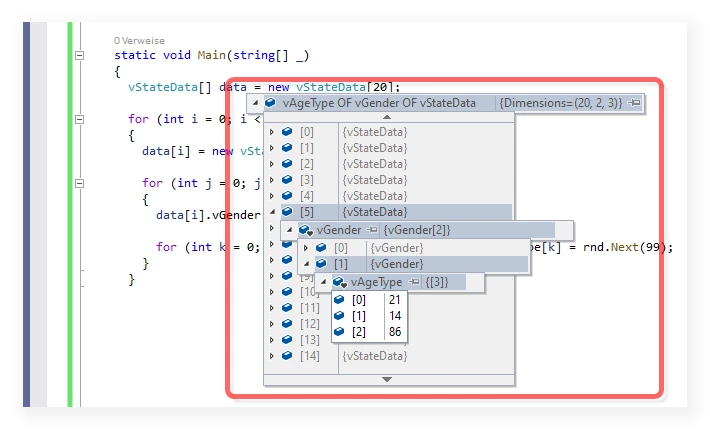
Visual COBOL should be able to inspect multidimensional table data items like in this sketch:

With the current version of Visual COBOL it's impossible to inspect multidimentional table data items in a debugging session:
Visual COBOL should be able to inspect multidimensional table data items like in this sketch:

Already have an account? Login
No account yet? Create an account
Enter your E-mail address. We'll send you an e-mail with instructions to reset your password.