


We've created a short series of videos on using COBOL Profiler, a feature of OpenText Micro Focus Visual COBOL. Profiler helps you analyze performance of your COBOL application, by reviewing statistics gathered during execution. Profiler can gather these statistics without the need for program changes.
With Profiler, you can do things like:
- Figure out which portion of your application is taking the most CPU time (or, Elapsed time) to execute. This can be seen at the level of COBOL Programs in a multi-program application, or down at the level of COBOL paragraphs and sections within a program
- Help discover where performance bottlenecks are that might be affecting your migration to a different product version or platform
- Accumulate statistics across multiple application executions, so that you can summarize performance when running with varying tests and data
- Links to the videos:
Visual COBOL: Introduction to Micro Focus COBOL Profiler
Visual COBOL: Profiler Advanced Usage
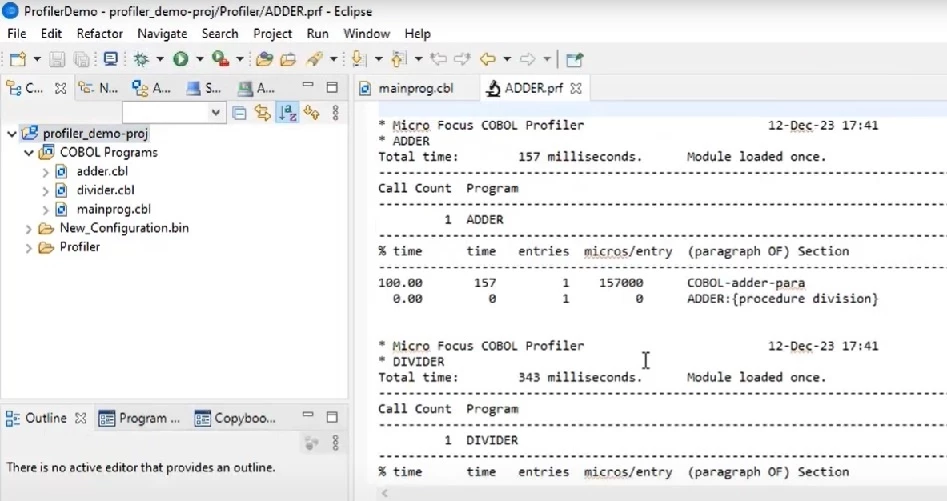
Visual COBOL: Using Profiler in the Eclipse IDE
#SupportTips/SupportTips/KnowledgeDocs
#SupportTips/KnowledgeDocs
