

Introducing Observability in Uniface: Real-Time Insights Without Code Changes
Authored by: Dongbo Zhang, Senior Software Engineer, Rocket Uniface
Observability is the ability to understand what is happening inside your applications by collecting and analyzing metrics, logs, and traces. With Uniface’s new Observability feature, you can monitor application performance and behavior in real time - without changing your application code.
This capability is built on OpenTelemetry, an industry-standard framework for observability, making it easier to integrate Uniface with popular monitoring tools like Tempo, Loki, Grafana, Jaeger, or Elastic Stack.
What's New?
Starting with Uniface 10.4.03-030, Observability is now a native feature. Here is what you get:
- OpenTelemetry Integration: Uniface now speaks the language of modern observability. You can export traces and logs directly to your preferred observability platform - whether it is Jaeger, Tempo, Loki, or Elastic Stack - without additional complexity.
- Real-Time Monitoring: Gain immediate insights into performance, latency, and system behavior, enabling proactive troubleshooting and faster resolution by examining the telemetry data produced by your Uniface Application.
- Zero Code Changes Required: Observability is enabled through configuration, not development effort. This means you can start monitoring today without touching your application logic.
- Support for Diverse Environments: Whether you run on Windows or Linux, Observability works out of the box, ensuring consistent monitoring across your infrastructure.
Why It Matters to You
Modern applications demand visibility. Without observability, troubleshooting issues can feel like searching in the dark. This feature means:
- Faster Problem Resolution: Identify bottlenecks and errors quickly.
- Improved Reliability: Monitor performance trends and prevent outages before they happen.
- Better Customer Experience: Ensure your applications run smoothly and meet SLAs.
- Industry Alignment: Adopt OpenTelemetry, the global standard for observability.
In short, this is about control, confidence, and efficiency in managing your Uniface applications.
Quick Setup: Minimal Configuration Example
Add the following section to your Uniface assignment file to turn on Observability:
[Observability]
TRACE=ON
LOG=ON
TRACE_ENDPOINT = http://host:port/v1/traces
LOG_ENDPOINT = http://host:port/v1/logs
The minimal setup gets you started quickly, but Uniface provides additional parameters for configuring Observability, e.g. adding extra telemetry data to trace spans. For the full list of supported parameters and examples, see the official Uniface online documentation.
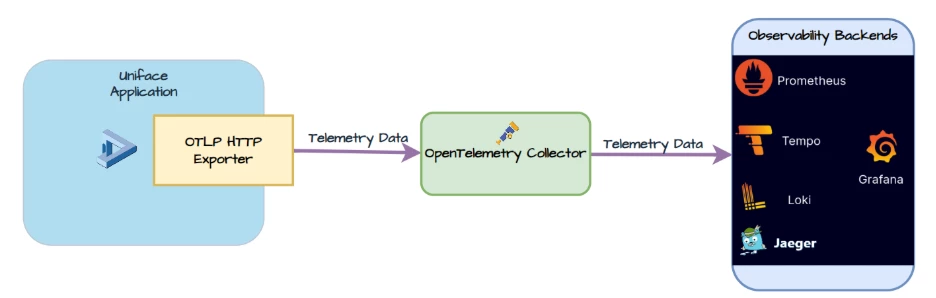
Uniface uses the OTLP HTTP exporter to send telemetry data to any backend that supports the OTLP protocol.
For more flexibility, you can introduce an OpenTelemetry Collector between Uniface and your observability tools. The Collector acts as a gateway, receiving telemetry from Uniface, processing it, and routing it backends.
What’s Next?
Ready to take advantage of Observability in Uniface? Here is what you should do:
- Upgrade to Uniface 10.4.03-030 or later to access the feature.
- Explore the Documentation: Uniface Observability Guide.
- Start Monitoring Today: Configure your Uniface Application and connect to your favorite dashboard tool.
We are committed to helping you build, test, and deploy applications that are smarter, safer, and easier to manage. Do you have feedback or ideas for new features? We would love to hear from you!
