Rocket Modern Experience (formerly LegaSuite)

 View Only

 View Console log from engine side JavaScript in browser when deployed to QA Server

Ameer Salman's profile image
Ameer Salman posted 07-24-2024 06:35

Hi,

I have linked an engine-side JavaScript file to a page onLoad and deployed it to the QA server, but I cannot view the console in my browser console. Is there any way I can view the console to confirm that the script is called correctly after the server is deployed? Can anyone provide a solution for this?

Sample engine side script :

import * as fs from 'mx:fs';
import {Field} from 'mx:emulator';

console.log("Function Called")


Roger Van Valen's profile image
Roger Van Valen
Hi Ameer,
 
There are several ways to get to the console log and even debug the JavaScript in the engine, recommended is to use the debugging framework.
 
When working from the workbench:
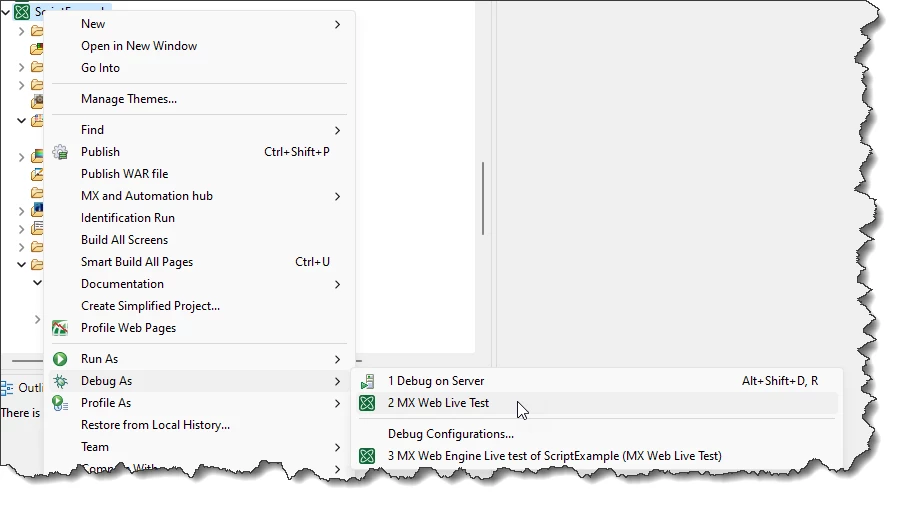
  • Right-click your project in the resource explorer and select 'Debug As -> MX Web Live test'
    Dialog for starting debug as live test from workbench
  • When the session is running, go to your browser, open a new window and in there open the inspect.
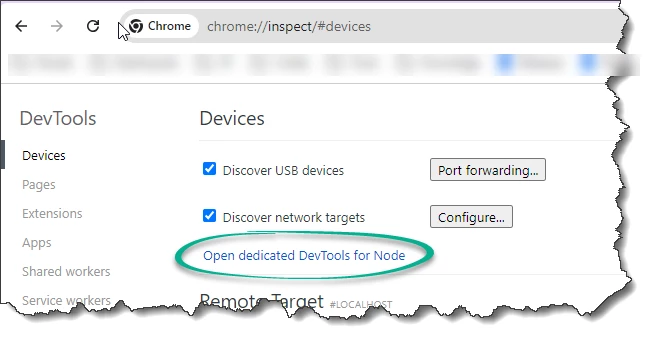
    In chrome, you can use chrome://inspect
  • Then click 'Open dedicated DevTools for node'
    Select dedicated DevTools for Node
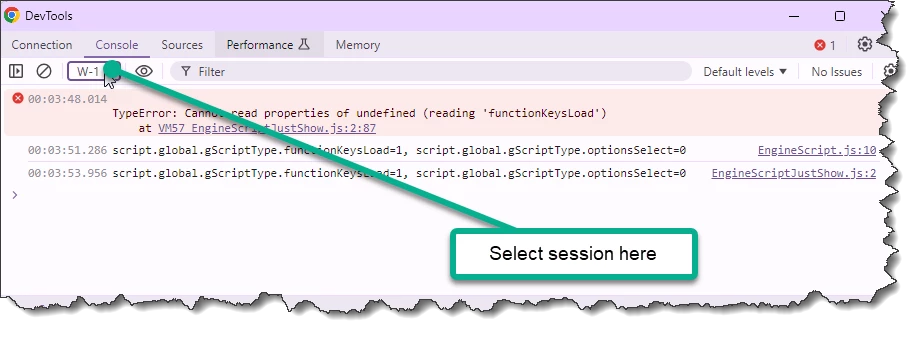
  • You should be able to select the session you are using in this console, and see the output:
    Select session in DevTools
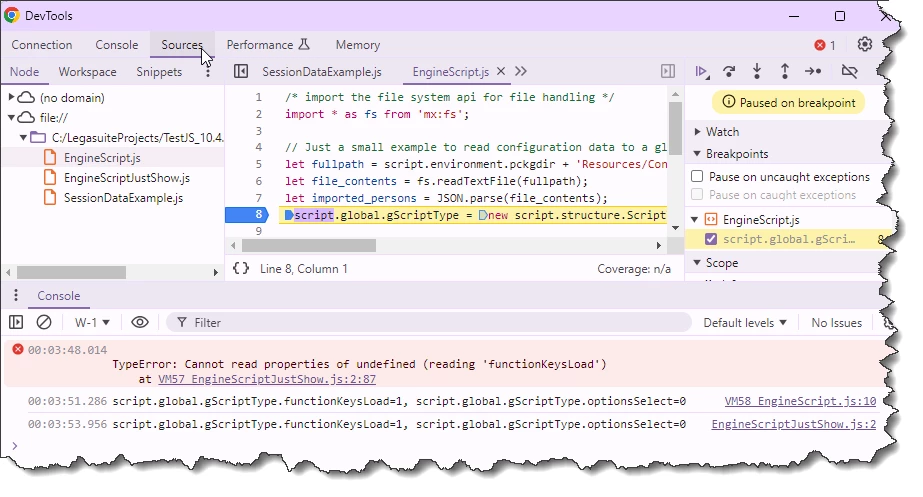
  • When you switch to the 'Sources' folder you can also open the debugger and put a breakpoint, in order to step through the code and see variables:
    Debugger
 
When you are not working from the workbench but instead want to debug on an engine running a deployed package, you will need to configure the engine to open up a port for debugging.
As debugging is a significant configuration that needs to be set on the start of the engine, this cannot be done through the deployment.properties in the hub.
The following can be added to the INI file of the engine (LegaSuite.ini) to enable the debugging framework of the engine.
JavaScriptInspectEnable=1
JavaScriptInspectPort=9229
JavaScriptInspectAddress=0.0.0.0 
An engine restart will be required:
Also, we do not recommend using this in production systems, but only on development and/or test systems, for security reasons.
 
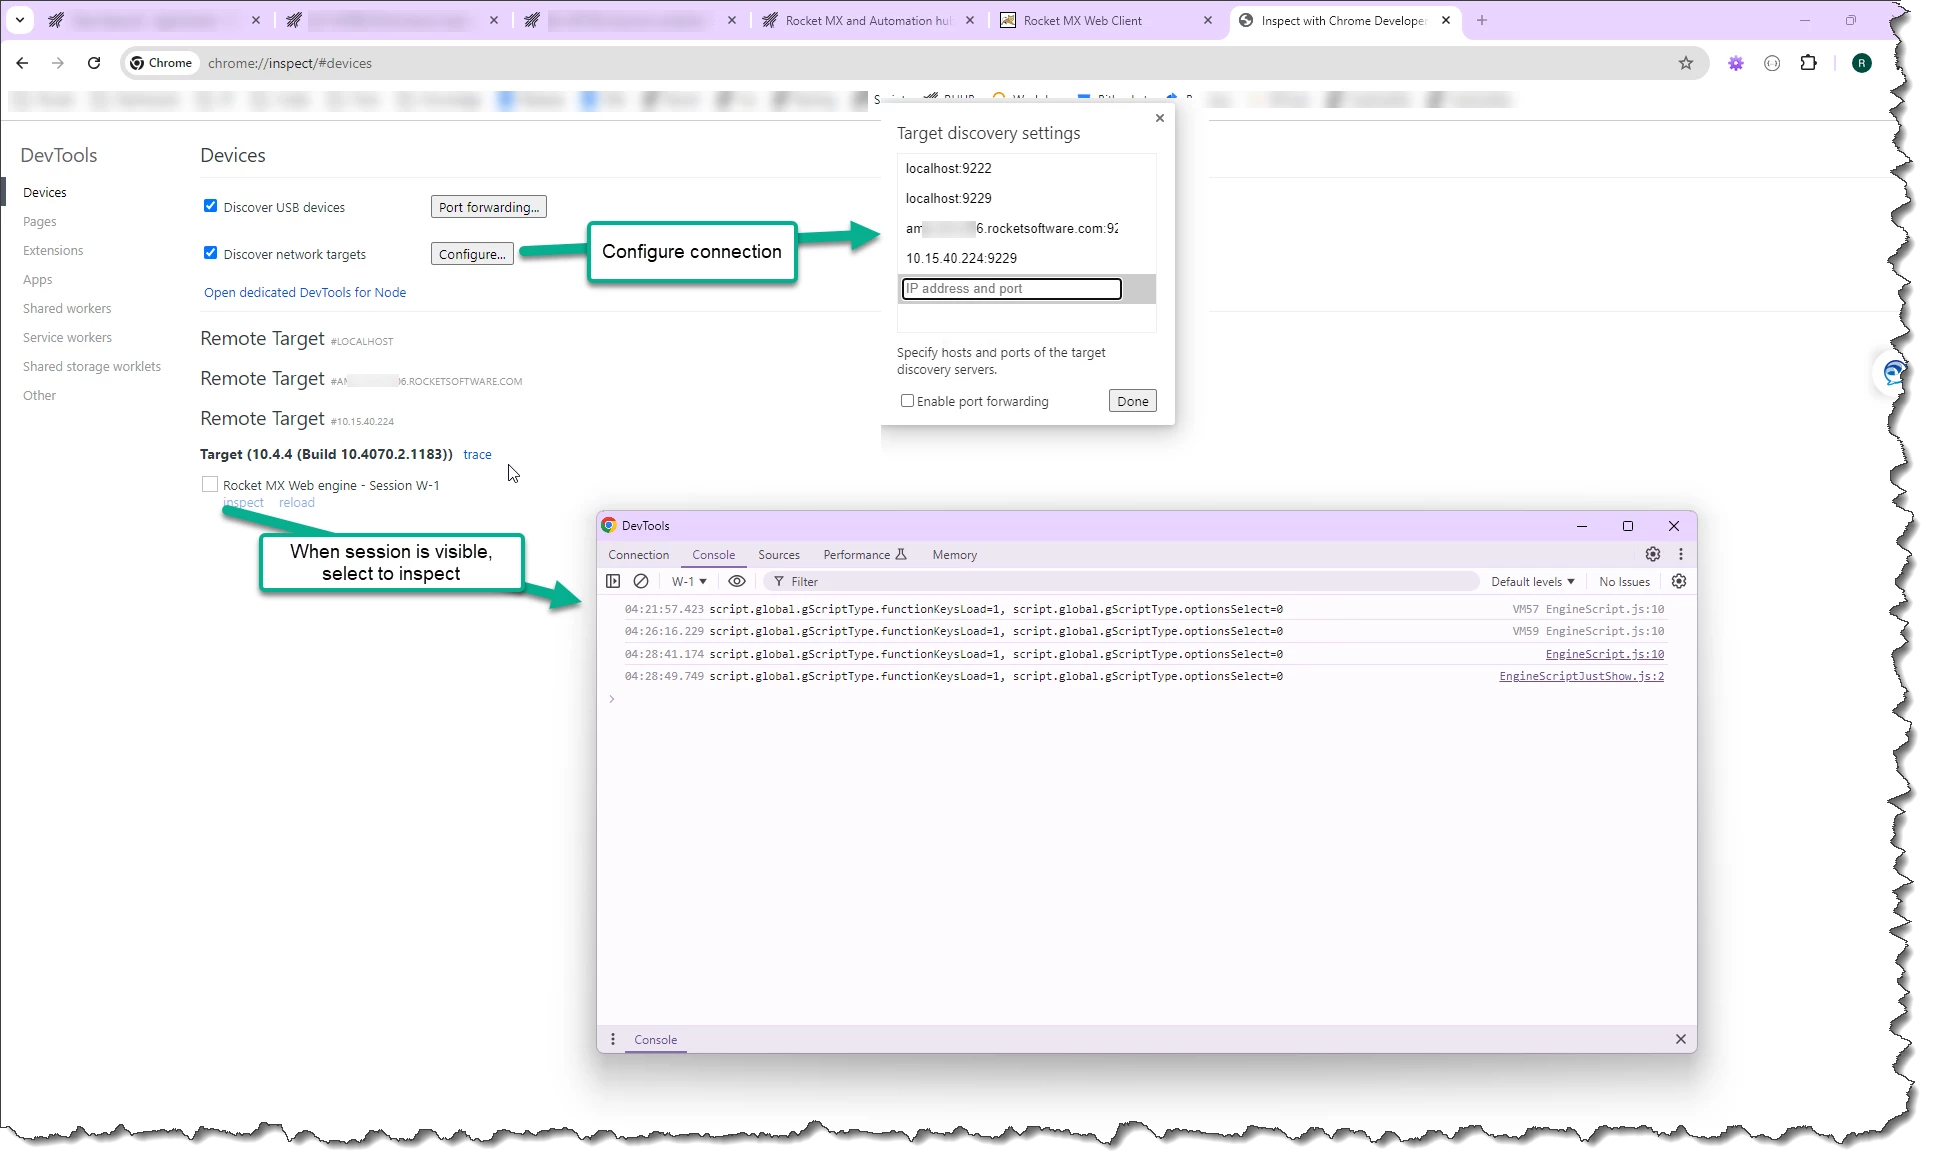
After restarting the engine with these settings, you can add the engine address in your chrome://inspect connection configuration.
Sometimes named addresses can be used, but these will not always work, sometimes an IP address will do the trick.
And once configured, sessions running JavaScript should be visible in the dialog. Clicking the 'inspect' link will open the DevTools:
Remote debugging dialog
Note that firewalls must be configured to pass trough the information for port 9229 when debugging on a remote machine.
 
Another option is to scan the engine logs for javascript.console messages (level INFO):
For instance, this is a log message that may appear from engine side JavaScript:
2024-07-25 09:47:31,987 [8868] <{EID, Rocket_Development#1}{Session, I-1}> INFO  javascript.console - script.global.gScriptType.functionKeysLoad=1, script.global.gScriptType.optionsSelect=0 
 
Using the engine logs will not require to set up the debugging framework.
With the default log settings we provide in the products, these messages should be shown.
The log configuration can be altered to hide them (or make them visible if currently hidden).
 
Hope this helps,
Regards,
Roger van Valen.