Hi Freaks
Whenever I do a profiling, there are three things missing:

IDLETIME

Idle time

Time spent waiting for window manager events and user-action events, such as edit time in a non-modal form, response to askmess, and so on

DBMSTIME

DBMS time

Time spent waiting DBMS driver I/O

NETTIME

Network time

Time spent waiting for the network, including time for the Uniface Router/Server performing network DBMS I/O and activating distributed services over the network.

Anyone an idea, what to set to get this information?

Uniface 9.7.04 (817_1)

Ingo
Hi Freak,

The mentioned profiling information are only logged when the recorded time is > 0. If the info is missing then you can assume that it's 0. As a result this will reduce the size of the profiling log file, since unnecessary info is not written to the file.

Hope this helps.

Daniel


Hi Freaks
Whenever I do a profiling, there are three things missing:

IDLETIME

Idle time

Time spent waiting for window manager events and user-action events, such as edit time in a non-modal form, response to askmess, and so on

DBMSTIME

DBMS time

Time spent waiting DBMS driver I/O

NETTIME

Network time

Time spent waiting for the network, including time for the Uniface Router/Server performing network DBMS I/O and activating distributed services over the network.

Anyone an idea, what to set to get this information?

Uniface 9.7.04 (817_1)

Ingo

Hi Daniel
We do have heavy database IO and my assumption is, that I should see this in a record.
Example:
A global write procedure SO_WRITE calls some other global procs (GP_Xi).  (alltogether 1000 times)
Profiling telling me, that SO_WRITE takes 3.6 seconds over all (ELAPSETIME) and 2.6 ms internal (ELAPSETIME_X)
The sum of all GP_Xi are  840ms  (ELAPSETIME) resp. 298ms  (ELAPSETIME_X)
So there is a difference of ~2.8 seconds in GP_WRITE which should be the WRITE to database.
But there is no DBMSTIME at all!
Strange, or  ?

Ingo

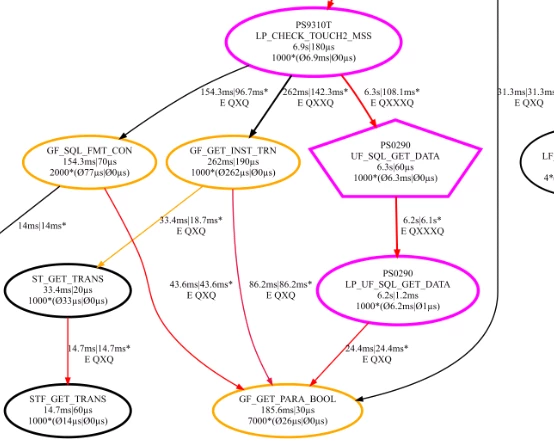
This is an actual output of the profiling:

LP_UF_SQL_GET_DATA does a ' sql/data v_CMD,"DEF" '
And there is till no DBMSTIME in log file 🙂

Ingo