ANALYZE_STATISTICS - CPU/memory consumption

  • April 8, 2019
  • 15 replies
  • 9 views

vcarusi
Forum|alt.badge.img+1

Hi,
I have a standalone server on Ubuntu 16.4, Vertica9.2.
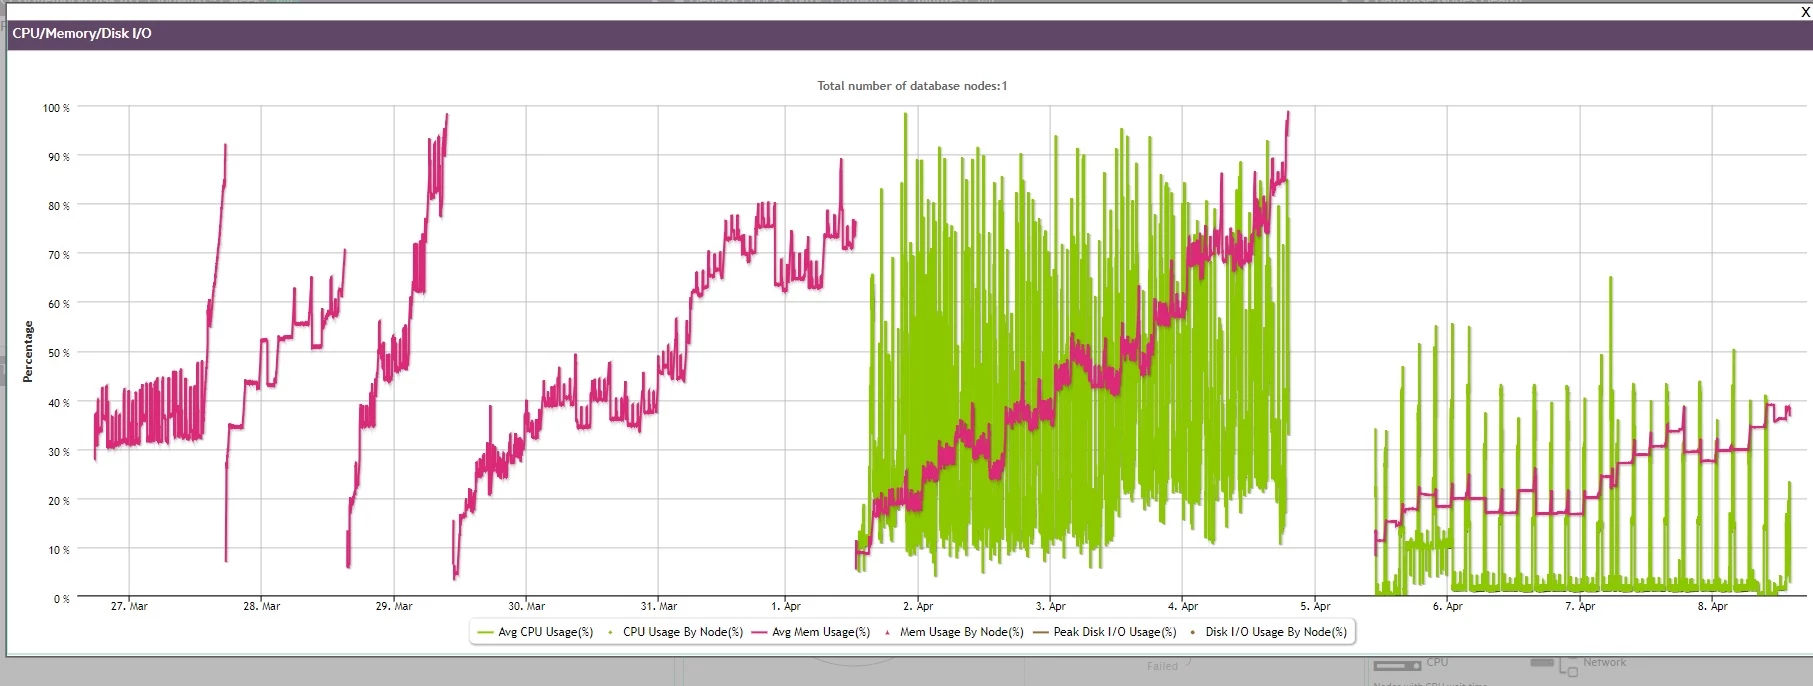
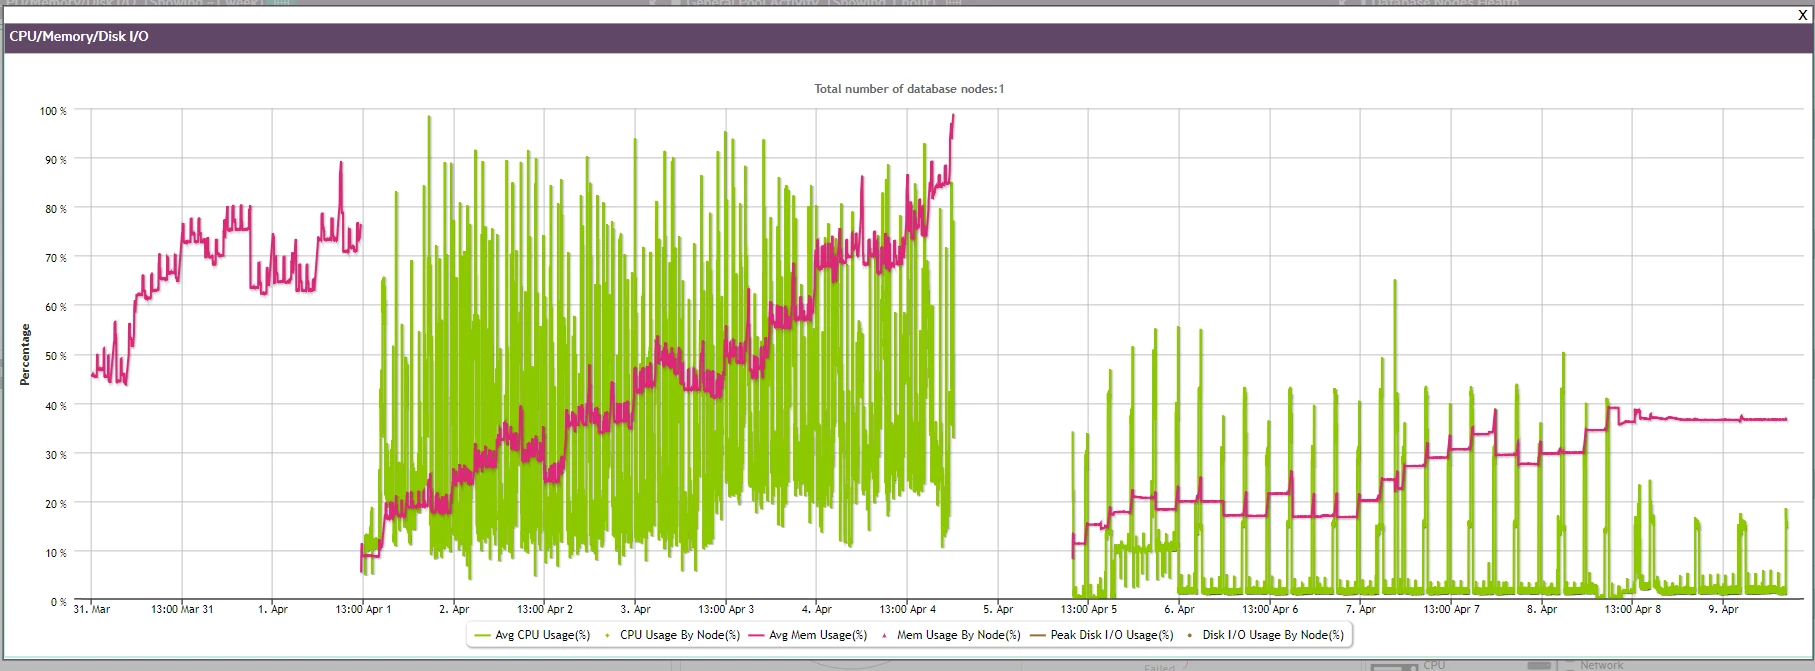
Every time when a ANALYZE_STATISTICS is executed, the CPU and memory consumptions have a jump. It seems these resources are not release at the end. As consequence, after few days the vertica server crash due to lack of memory.
I am not sure who is guilty : vertica or ubuntu ?
Did someone face with this behavior ?
Thank you,
Veronica

15 replies

vcarusi
Forum|alt.badge.img+1
  • Author
  • Participating Frequently
  • April 8, 2019

There is system table where are logged the events that force CPU/memory to grow ?


Jim_Knicely
Forum|alt.badge.img+2
  • Participating Frequently
  • April 8, 2019
dbadmin=> \dS *cpu*
                        List of tables
  Schema   |   Name    |  Kind  |    Description    | Comment
-----------+-----------+--------+-------------------+---------
 v_monitor | cpu_usage | system | CPU usage history |
(1 row)

dbadmin=> \dS *memory*
                           List of tables
  Schema   |     Name     |  Kind  |     Description      | Comment
-----------+--------------+--------+----------------------+---------
 v_monitor | memory_usage | system | Memory usage history |
(1 row)

Jim_Knicely
Forum|alt.badge.img+2
  • Participating Frequently
  • April 8, 2019

The QUERY_CONSUMPTION table has a ton of great info on a query, including CPU cycles consumed and memory reserved and allocated.

See:
https://www.vertica.com/docs/9.2.x/HTML/Content/Authoring/SQLReferenceManual/SystemTables/MONITOR/QUERY_CONSUMPTION.htm

Unfortunately ANALYZE_STATISTICS commands are not recorded in this table.


vcarusi
Forum|alt.badge.img+1
  • Author
  • Participating Frequently
  • April 8, 2019

Thank you!
v_monitor.memory_usage is a kind of log/history.
I would like to understand what events/queries force vertica server to allocate memory.

I have, at least once per per every week, a crash due to lack of memory. I need to understand its cause. I started closing processes one by one. It seems that ANALYZE_STATISTICS could be a cause.


vcarusi
Forum|alt.badge.img+1
  • Author
  • Participating Frequently
  • April 9, 2019


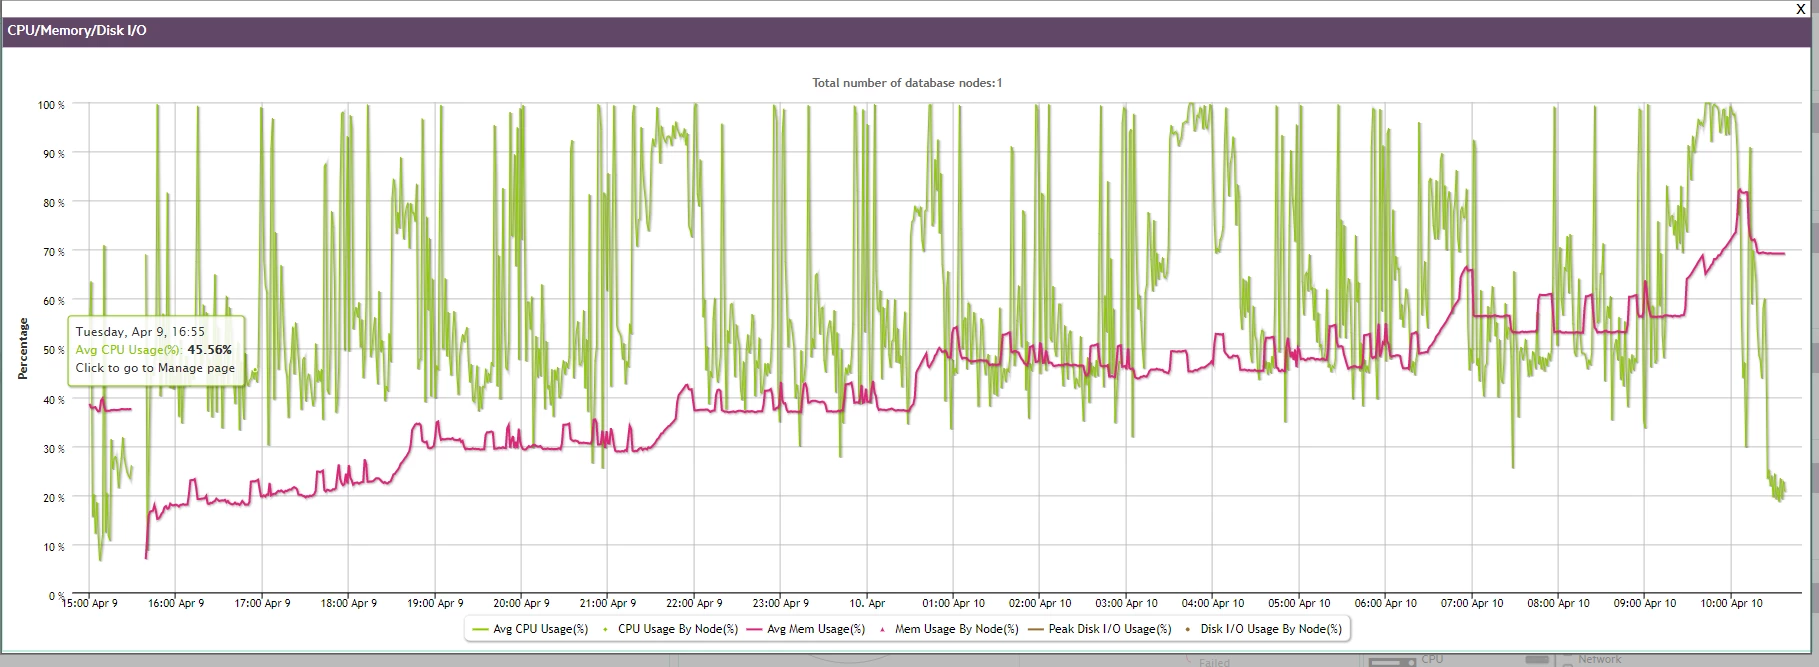
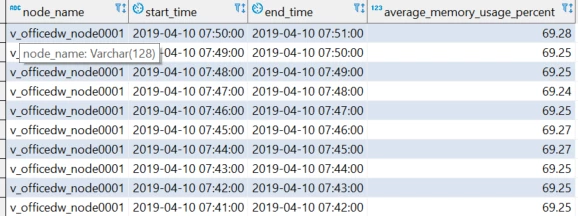
and here is the memory consumption with the process that gathers statistics stopped.
This process collects statistics for a 90 GB table, with 50 as parameter, every 3 h.


vcarusi
Forum|alt.badge.img+1
  • Author
  • Participating Frequently
  • April 9, 2019

Anyway, thank Jim for your support.


vcarusi
Forum|alt.badge.img+1
  • Author
  • Participating Frequently
  • April 9, 2019

is there a way to release memory ?


Jim_Knicely
Forum|alt.badge.img+2
  • Participating Frequently
  • April 9, 2019

Can you check if there is memory in use in your resource pools? There should not be any memory in use if the running query count is 0.

select node_name, pool_name, memory_size_kb, memory_size_actual_kb, memory_inuse_kb, general_memory_borrowed_kb, max_memory_size_kb, running_query_count from resource_pool_status where memory_inuse_kb > 0 and running_query_count = 0 and pool_name <> 'sysdata';

vcarusi
Forum|alt.badge.img+1
  • Author
  • Participating Frequently
  • April 10, 2019

Thank you, Jim!
Again I stopped all processes, included ANALYZE_STATISTICS.
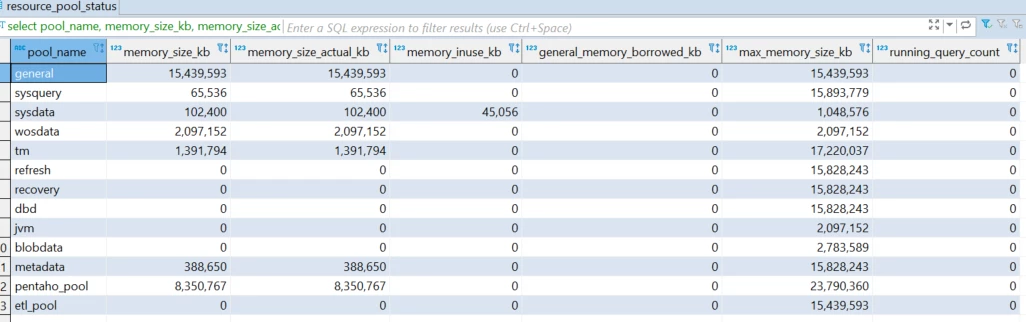
Memory is not released.

select pool_name, memory_size_kb, memory_size_actual_kb, memory_inuse_kb, general_memory_borrowed_kb, max_memory_size_kb, running_query_count
from resource_pool_status;

select * from v_monitor.memory_usage
order by start_time desc;

Any idea?


Jim_Knicely
Forum|alt.badge.img+2
  • Participating Frequently
  • April 10, 2019

How much memory is the Vertica process using?

Example. Here is an idle node on my cluster:

[dbadmin@s18384357 ~]$ ps ax | grep "[/]opt/vertica/bin/vertica " | awk '{print $1}'
475119

[dbadmin@s18384357 ~]$ pmap 475119 | tail -n 1
 total          5118564K

And after a clean restart:

[dbadmin@s18384357 ~]$ admintools -t stop_db -d test_db -F
Info: no password specified, using none
        Connecting to database
        Issuing shutdown command to database
Database test_db stopped successfully
[dbadmin@s18384357 ~]$ admintools -t start_db -d test_db
Info: no password specified, using none
        Starting nodes:
                v_test_db_node0001 (74.208.100.58)
        Starting Vertica on all nodes. Please wait, databases with a large catalog may take a while to initialize.
        Node Status: v_test_db_node0001: (DOWN)
        Node Status: v_test_db_node0001: (DOWN)
        Node Status: v_test_db_node0001: (DOWN)
        Node Status: v_test_db_node0001: (DOWN)
        Node Status: v_test_db_node0001: (UP)
Database test_db: Startup Succeeded.  All Nodes are UP
[dbadmin@s18384357 ~]$ ps ax | grep "[/]opt/vertica/bin/vertica " | awk '{print $1}'
493879
[dbadmin@s18384357 ~]$ pmap 493879 | tail -n 1
 total          3840076K

But as I use more resources, the process will allocate more RAM.

[dbadmin@s18384357 ~]$ vsql -c "SELECT analyze_statistics('', 100);"
 analyze_statistics
--------------------
                  0
(1 row)

[dbadmin@s18384357 ~]$ pmap 493879 | tail -n 1
 total          5971048K

This memory is not released. It just remains allocated.

[dbadmin@s18384357 ~]$ vsql -c "create table big_table2 as select * from big_table;"
CREATE TABLE

[dbadmin@s18384357 ~]$ vsql -c "create table big_table3 as select * from big_table;"
CREATE TABLE

[dbadmin@s18384357 ~]$ pmap 493879 | tail -n 1
 total          8073324K

[dbadmin@s18384357 ~]$ vsql -c "SELECT analyze_statistics('', 100);"
 analyze_statistics
--------------------
                  0
(1 row)

[dbadmin@s18384357 ~]$ pmap 493879 | tail -n 1
 total          8073324K

Vertica will allocate up the MAXMEMORYSIZE of the General Pool.

In my case:

[dbadmin@s18384357 ~]$ vsql -c "SELECT max_memory_size_kb FROM resource_pool_status WHERE pool_name = 'general';"
 max_memory_size_kb
--------------------
            8963349
(1 row)

vcarusi
Forum|alt.badge.img+1
  • Author
  • Participating Frequently
  • April 10, 2019

top

  • 07:55:27 up 19:23, 2 users, load average: 0.80, 0.88, 1.49
    Tasks: 158 total, 1 running, 157 sleeping, 0 stopped, 0 zombie
    %Cpu(s): 16.2 us, 2.2 sy, 0.1 ni, 81.5 id, 0.1 wa, 0.0 hi, 0.0 si, 0.0 st
    KiB Mem : 31398092 total, 1963840 free, 21478656 used, 7955596 buff/cache
    KiB Swap: 2097148 total, 1743752 free, 353396 used. 9467712 avail Mem

    PID USER PR NI VIRT RES SHR S %CPU %MEM TIME+ COMMAND
    2864 dbadmin 20 0 26.573g 0.019t 39856 S 4.0 65.7 1538:53 vertica
    1506 dbadmin 20 0 1251452 20712 6032 S 1.0 0.1 113:25.70 python
    23 root 20 0 0 0 0 S 0.3 0.0 0:11.51 ksoftirqd/3
    5410 ubuntu 20 0 92800 3228 2328 S 0.3 0.0 0:33.38 sshd
    1 root 20 0 37728 4728 3012 S 0.0 0.0 0:04.27 systemd
    2 root 20 0 0 0 0 S 0.0 0.0 0:00.00 kthreadd

Memory used : 65%
You are right. After restart. the memory is released.
But it isn't a suitable solution because the server is a production one.


vcarusi
Forum|alt.badge.img+1
  • Author
  • Participating Frequently
  • April 10, 2019

So

  • vertica asks for memory from system
  • the system allocates it
  • vertica runs its processes, but doesn't release the memory back to system

in order to keep the memory under control should be identified the vertica processes that force vertica server to ask for memory from system

thank you


Jim_Knicely
Forum|alt.badge.img+2
  • Participating Frequently
  • April 10, 2019

This shouldn't be an issue if you are following the recommendation:

Deploy Vertica as the only active process on each host—other than Linux processes or software explicitly approved by Vertica. Vertica cannot be colocated with other software. Remove or disable all non-essential applications from cluster hosts.

See:
https://www.vertica.com/docs/9.2.x/HTML/Content/Authoring/InstallationGuide/BeforeYouInstall/platformhardwarereqts.htm

You can allocate less memory to Vertica by lowering the MAXMEMORYSIZE of the General Pool. But I wouldn't recommend that on a production system.

See:
https://www.vertica.com/docs/9.2.x/HTML/Content/Authoring/SQLReferenceManual/Statements/Built-inPoolConfiguration.htm


vcarusi
Forum|alt.badge.img+1
  • Author
  • Participating Frequently
  • April 12, 2019

https://www.vertica.com/docs/9.2.x/HTML/Content/Authoring/AdministratorsGuide/Statistics/BestPracticesForStatisticsCollection.htm?tocpath=Administrator's Guide|Collecting Database Statistics|_____6

Overhead Considerations
Running ANALYZE_STATISTICS is an efficient but potentially long-running operation. You can run it concurrently with queries and loads in a production environment. However, the function can incur considerable overhead on system resources (CPU and memory), at the expense of queries and load operations. To minimize overhead, run ANALYZE_STATISTICS on individual tables rather than the entire database, or on individual table columns.


vcarusi
Forum|alt.badge.img+1
  • Author
  • Participating Frequently
  • April 12, 2019

What are the configuration parameters regarding ANALYZE_STATISTICS ?

I found only AnalyzeRowCountInterval. Its default value corresponds to 24h.

i checked with
select statistics_updated_timestampt
from V_CATALOG.PROJECTION_COLUMNS
and statistics_updated_timestamp was 2 days ago.