

Question

Database Startup issue

  • November 14, 2019
  • 6 replies
  • 17 views

verban
Forum|alt.badge.img+1
  • Participating Frequently

Hello everyone,

I have 3 nodes DB on Vertica 9.2 on two ESXi Servers,
Few days ago i found two of nodes was gone (It was due to disk issue)
So i restart those nodes (VM) but vertica didn't start
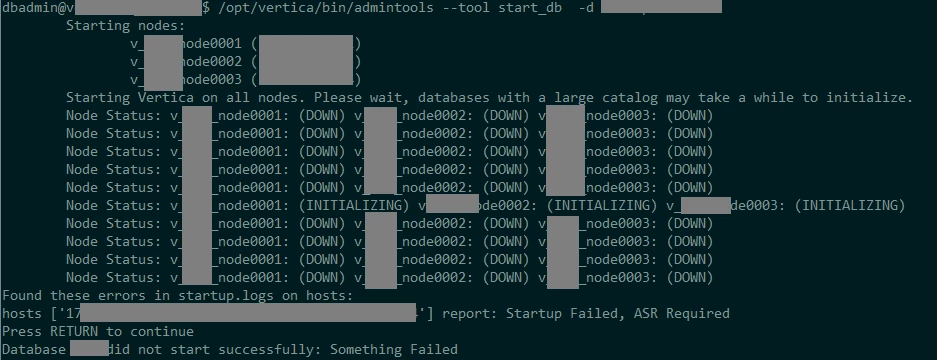
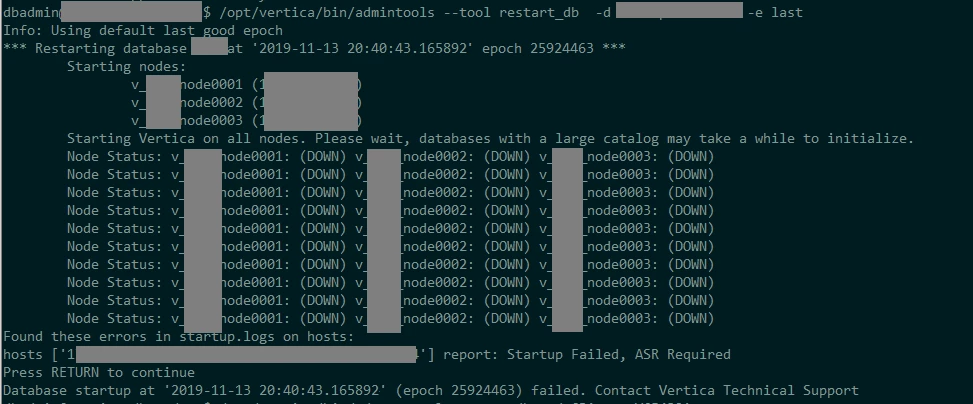
So i tried to do rollback to LGE, but i didn't help me:
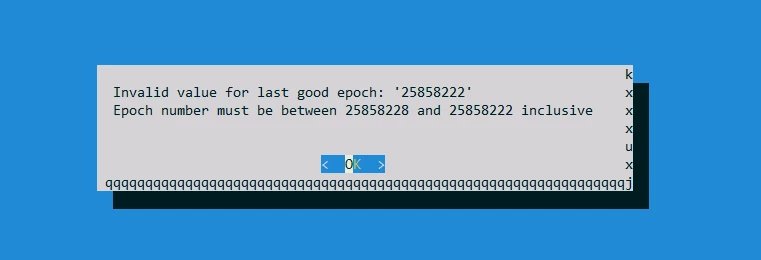
Also i tired to rollback from admintools gui, and i got strange message (first epoch greater than 2nd):
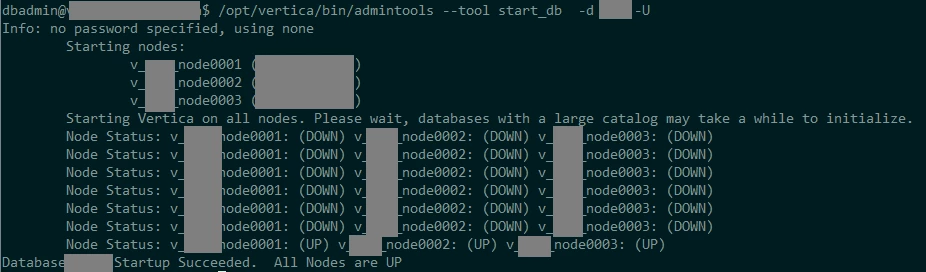
so I Started DB in unsafe mode:
and then i did what @skamat said in this topic:
https://forum.vertica.com/discussion/comment/238515/#Comment_238515
but i don't have any projection that has CPE lower than AHM epoch now.
My DB is only start in unsafe mode now.
and in this case i can't do MAKE_AHM_NOW:
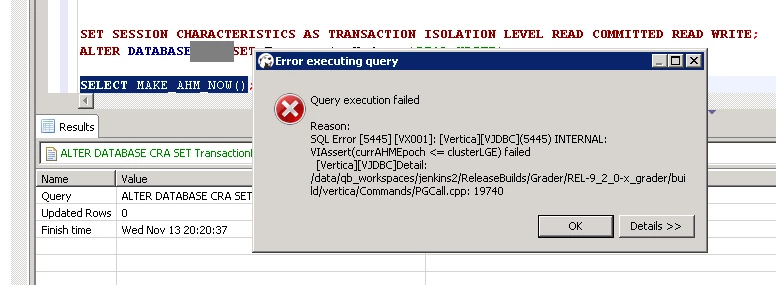
Please help me to fix it.

6 replies

Nimmi_gupta
Forum|alt.badge.img
  • Participating Frequently
  • November 14, 2019

From the recovery cleark node can you provide the ASR detail information.


verban
Forum|alt.badge.img+1
  • Author
  • Participating Frequently
  • November 15, 2019

Please let me know how can i provide it?


Nimmi_gupta
Forum|alt.badge.img
  • Participating Frequently
  • November 15, 2019

Is it possible to attach the vertica.log from all the 3 nodes? I can get that info once we have the log.


verban
Forum|alt.badge.img+1
  • Author
  • Participating Frequently
  • November 16, 2019

Thanks @Nimmi_gupta
Please find the attached log


Nimmi_gupta
Forum|alt.badge.img
  • Participating Frequently
  • November 18, 2019

1) As per vertica.log from Node3 (you have shared), there is a warning for LGE < AHM.
LGE=0x18a90ae --> 25858222
AHM=0x18a90b4 --> 25858228
From vertica.log
2019-11-16 10:39:10.849 DistCall Dispatch:7fb0c4d06700 [Recover] LGE=0x18a90ae, AHM=0x18a90b4, LGE < AHM. Data may be corrupted.
2019-11-16 10:39:10.849 DistCall Dispatch:7fb0c4d06700 [Main] Writing epoch=0x18a90ae, ending at '2019-11-10 10:35:03.523396+03:30', catalog version=0x40453eb, K-safety=0, AHM=0x18a90b4, ending at '2019-11-10 10:35:03.523396+03:30', to epoch log file [/vertica/DB/v_yyyy_node0003_catalog/Epoch.log]
Can you start the database in unsafe mode and run the below query
select projection_name, is_up_to_date,checkpoint_epoch,would_recover,is_behind_ahm from v_catalog.projection_checkpoint_epochs where is_behind_ahm;
select get_current_epoch(), get_last_good_epoch(), get_ahm_epoch(), get_ahm_time(), sysdate;


verban
Forum|alt.badge.img+1
  • Author
  • Participating Frequently
  • November 27, 2019

Thanks Nimmi and sorry for the late reply,
First query didn't returned any result and second one was:

Name               |Value                                             |
-------------------|--------------------------------------------------|
get_current_epoch  |25978958                                          |
get_last_good_epoch|25924401                                          |
get_ahm_epoch      |25858228                                          |
get_ahm_time       |Current AHM Time: 2019-11-10 07:35:03.523396|
sysdate            |2019-11-19 08:26:27

In recent days i exported all the tables and schema manually (in unsafe mode) and rebuild database (because i needed to fix it asap).
I faced this issue for 3rd time in last month, I think VERTICA should workaround it.

