

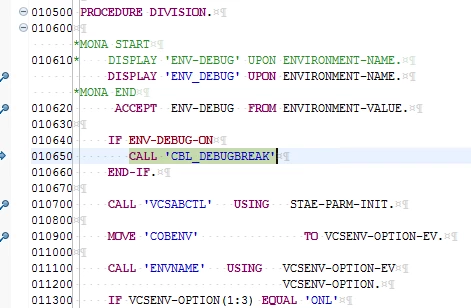
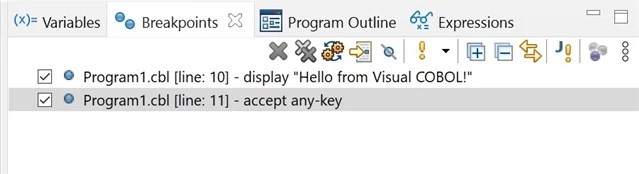
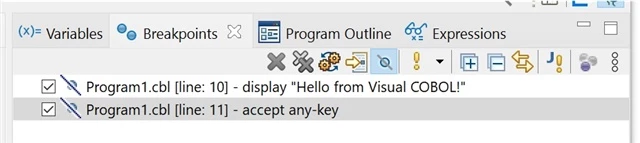
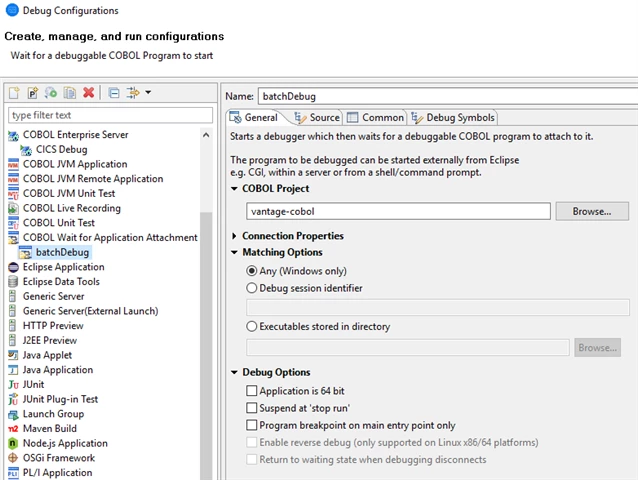
I'm trying to debug a batch COBOL program. It stops on entry to my initial module, but when I push F5 it doesn't go to the next instruction, it runs to the end. I've got breaks in called program so tried F8 and it also runs to the end. This worked (F5 going to next instruction and F8 running to break) until the middle of last week. This morning I had another developer open my project and submit the job. For him F5 does step through the program. So he closed and I opened and still doesn't work for me. We both did a printenv and compared our environment variables and the only differences where our session ID and folders we are linked to.

debug not stopping for developer


Sign up
Already have an account? Login
Welcome to the Rocket Forum!
No account yet? Create an account
Please log in or register:
Employee Login | Registration Member Login | RegistrationEnter your E-mail address. We'll send you an e-mail with instructions to reset your password.